Onze Content Packs voor Microsoft Dynamics ERP- en CRM oplossingen bieden out-of-the-box Power BI dashboards en rapportages.
Bij al onze Power BI implementaties heb je binnen een paar dagen toegang tot Dynamics 365 data in de vorm van deze Power BI dashboards.
Deze kun je vervolgens naar eigen behoefte aanpassen met het onderliggende rijke datamodel.
Naast data uit oplossingen zoals Dynamics Business Central en Finance & Operations, kunnen wij ook data uit andere bedrijfssoftware ontsluiten, structureren en modelleren voor gebruik in Power BI dashboards.
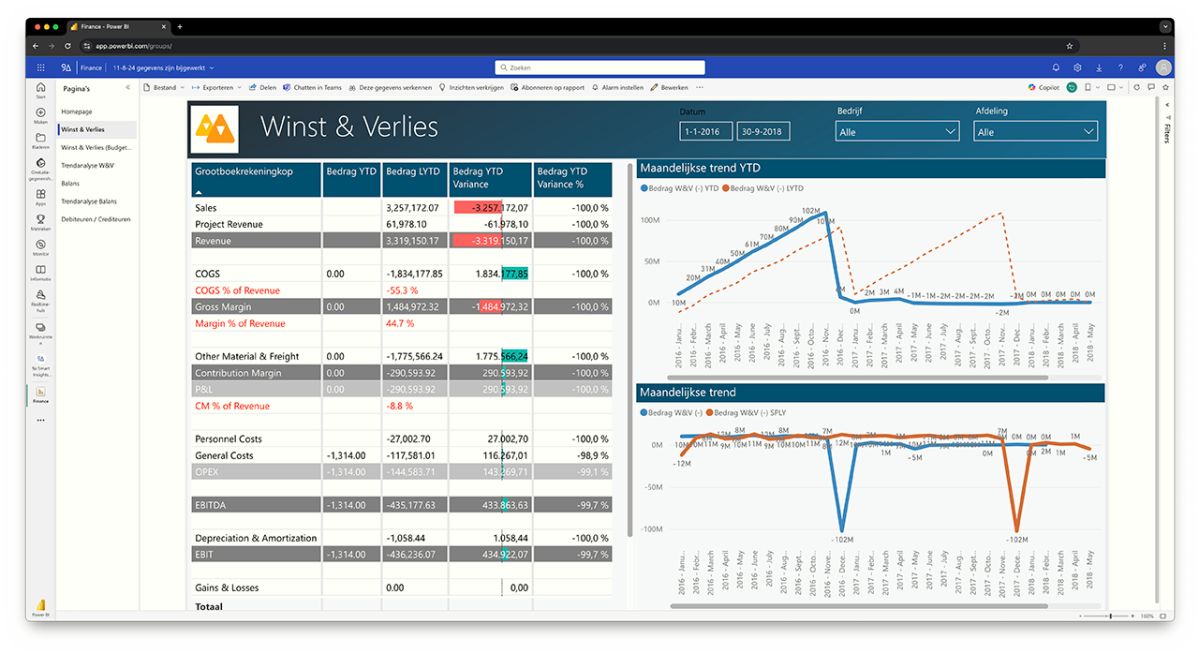
Finance dashboards
Diepgaande inzichten in o.a. winst & verlies, budgettering, balans en debiteuren/crediteuren. Ook bieden we een dashboard met rekeningen zonder mapping.
Met de verschillende componenten en drill-down mogelijkheden kun je vervolgens nog dieper in de data duiken. Met de financiële dashboards en rapportages kun je per bedrijf binnen de groep en per afdeling analyses maken.
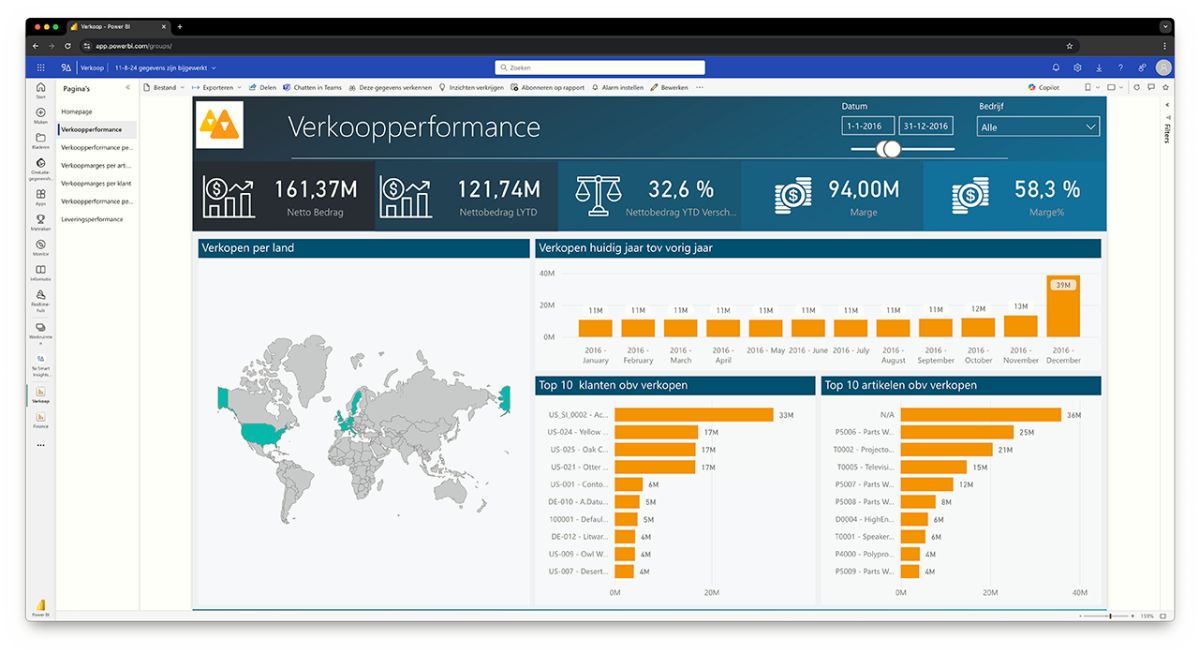
Sales dashboards
Diepgaande inzichten in o.a. verkoopperformance, verkoopmarges en leveringperformance. Bekijk per klant of per artikel wat de resultaten zijn.
Met de verschillende componenten en drill-down mogelijkheden kun je vervolgens nog dieper in de data duiken en zaken zoals artikelgroepen en periodes met elkaar vergelijken.
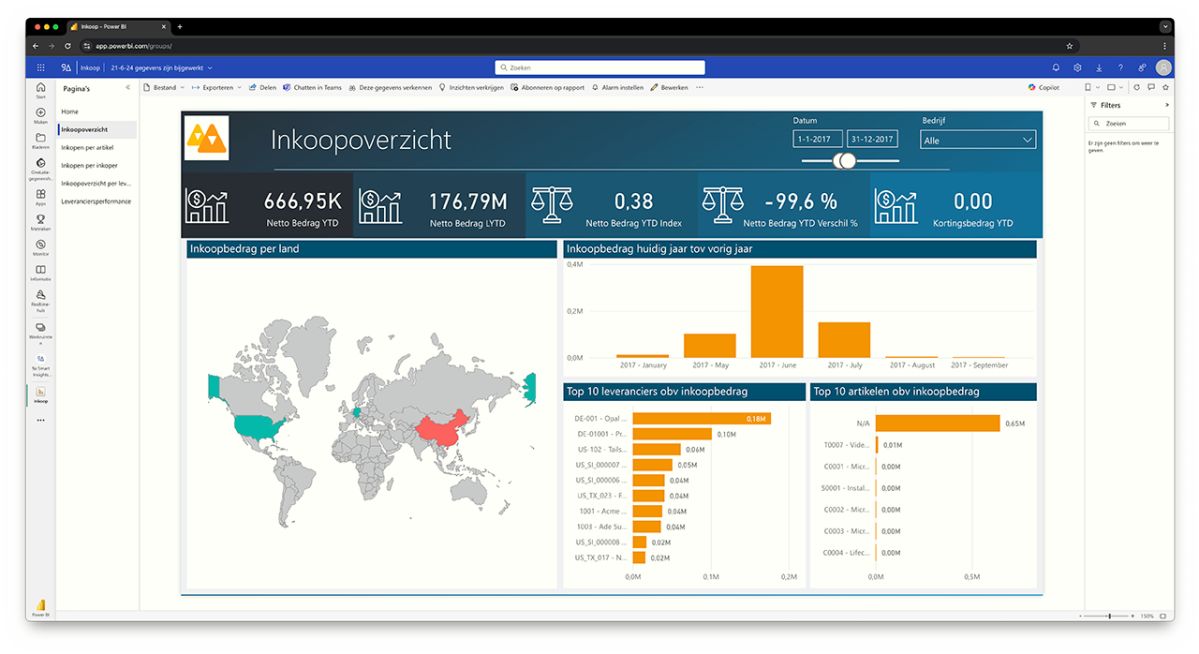
Inkoop dashboards
Een overzicht met data uit alle aspecten van de inkoop. Ook de performance per vestiging of leverancier wordt hier inzichtelijk.
Analyseer de data op basis van artikel, inkoper of leverancier. Gebruik de verschillende componenten en drill-down mogelijkheden voor nog diepere analyses.
Magazijn dashboards
Diepgaande inzichten in o.a. performance, voorraadbetrouwbaarheid, kwaliteitsorders, non conformiteiten en magazijn werkregels. Bekijk per magazijn of per bedrijf wat de resultaten zijn.
Met de verschillende componenten en drill-down mogelijkheden kun je vervolgens nog dieper in de data duiken en zaken zoals pickings en zendingen met elkaar vergelijken.

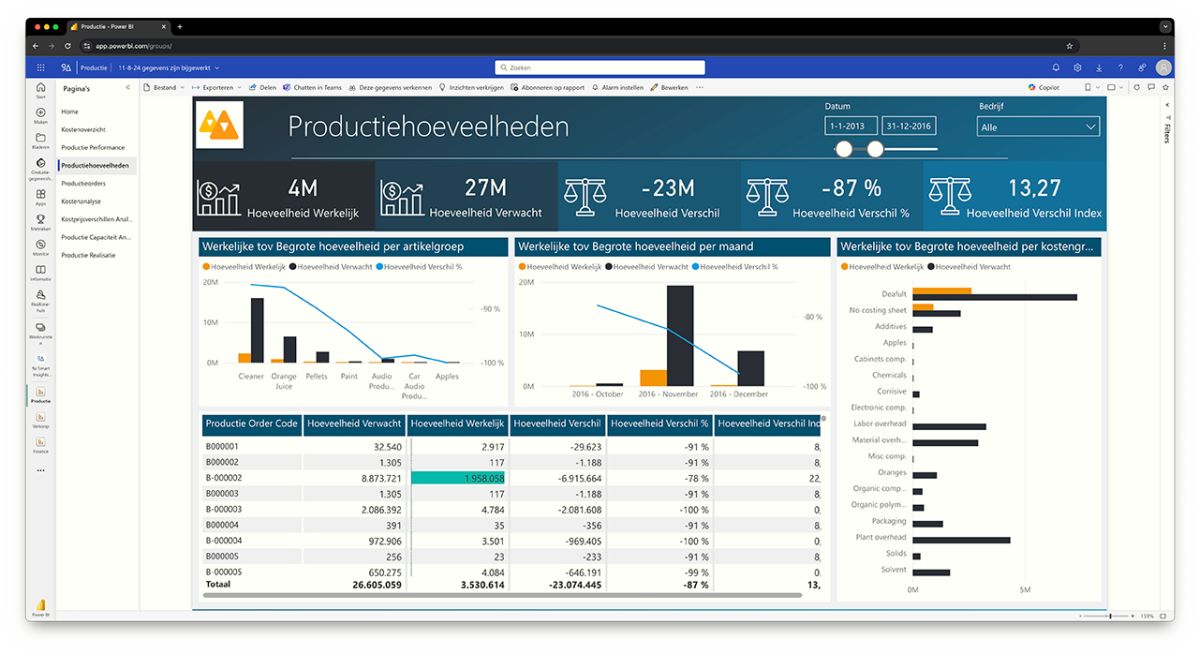
Productie dashboards
Diepgaande inzichten in o.a. productieperformance, -kosten, -orders en -capaciteit. Bekijk per artikel(groep) of bedrijf wat de resultaten zijn en stuur op KPI's zoals en OTIF en OEE.
Met de verschillende componenten en drill-down mogelijkheden kun je vervolgens nog dieper in de data duiken en de performance analyseren.
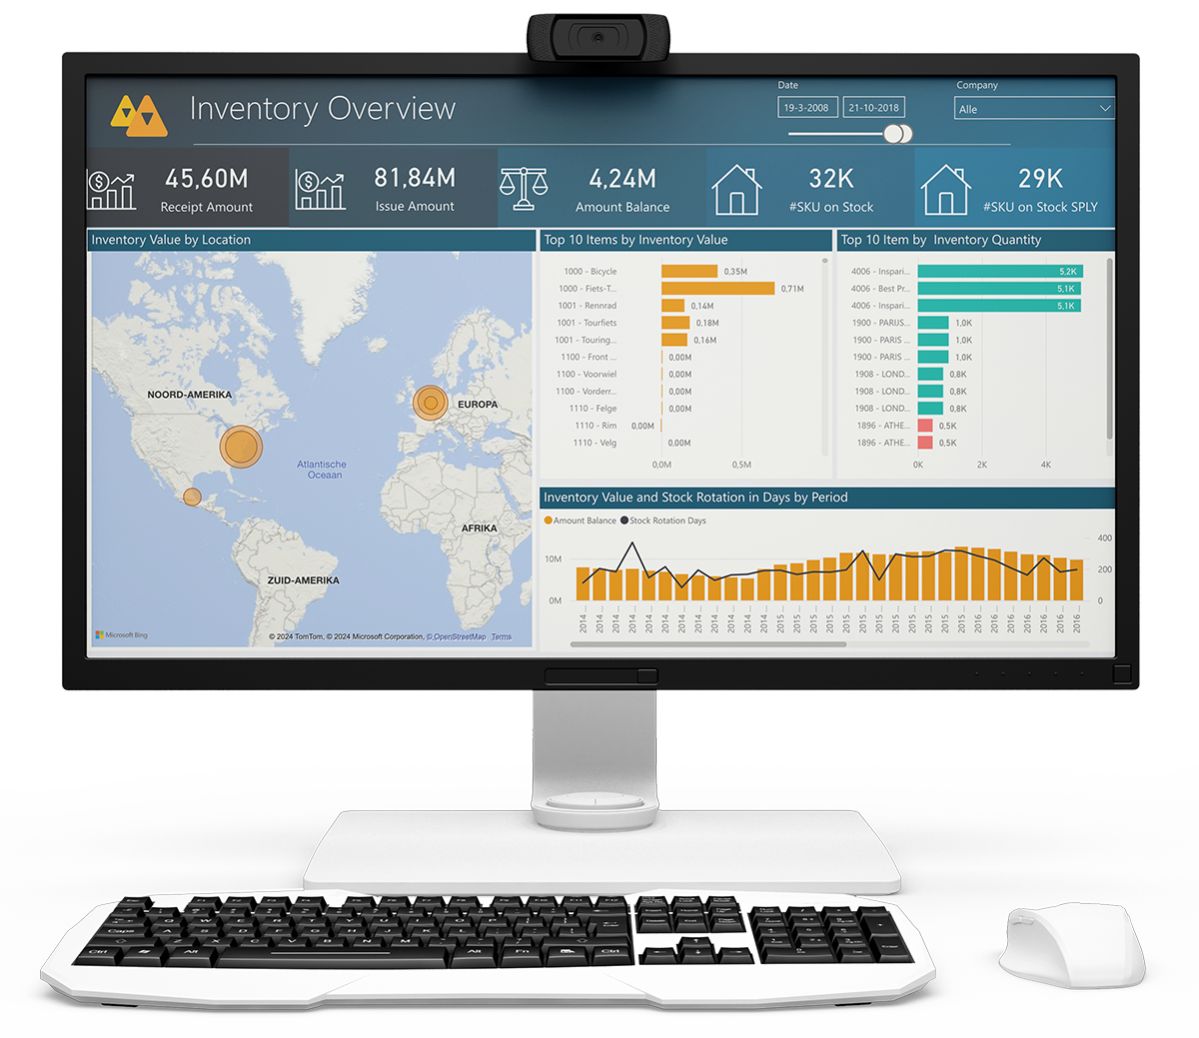
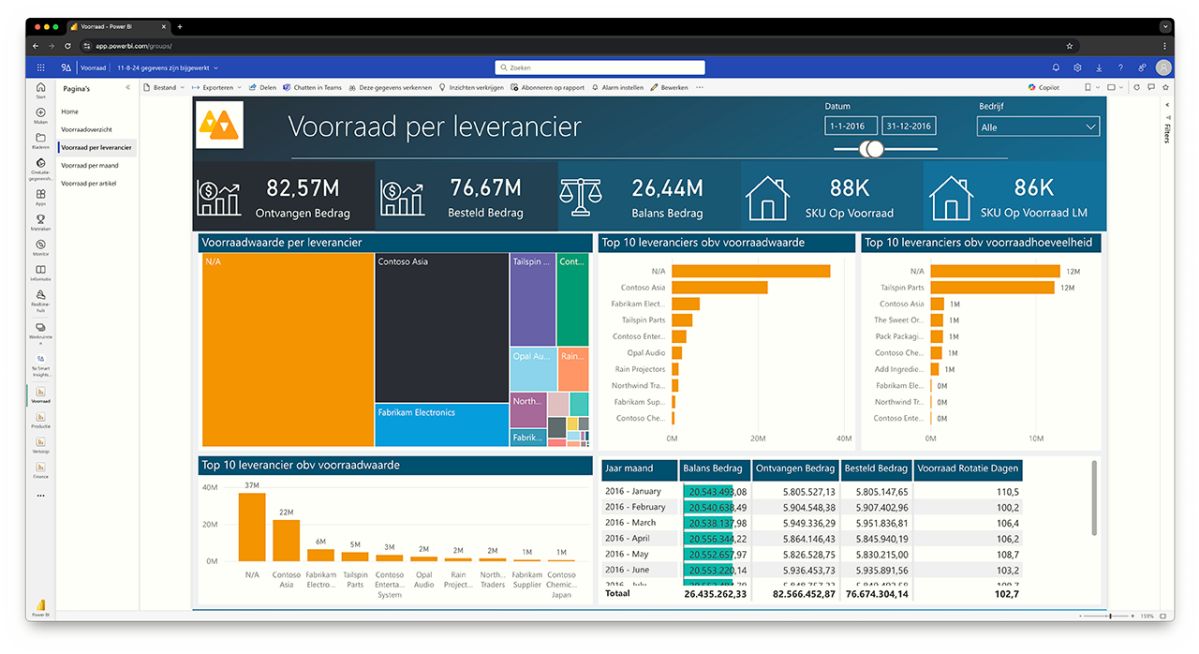
Voorraad dashboards
Krijg diepgaande inzichten in alle aspecten van je voorraad en bekijk de resultaten per seizoen of per bedrijf.
Analyseer de data op basis van artikelen, maanden, of leveranciers. Gebruik de verschillende componenten en drill-down mogelijkheden voor nog diepere analyses.
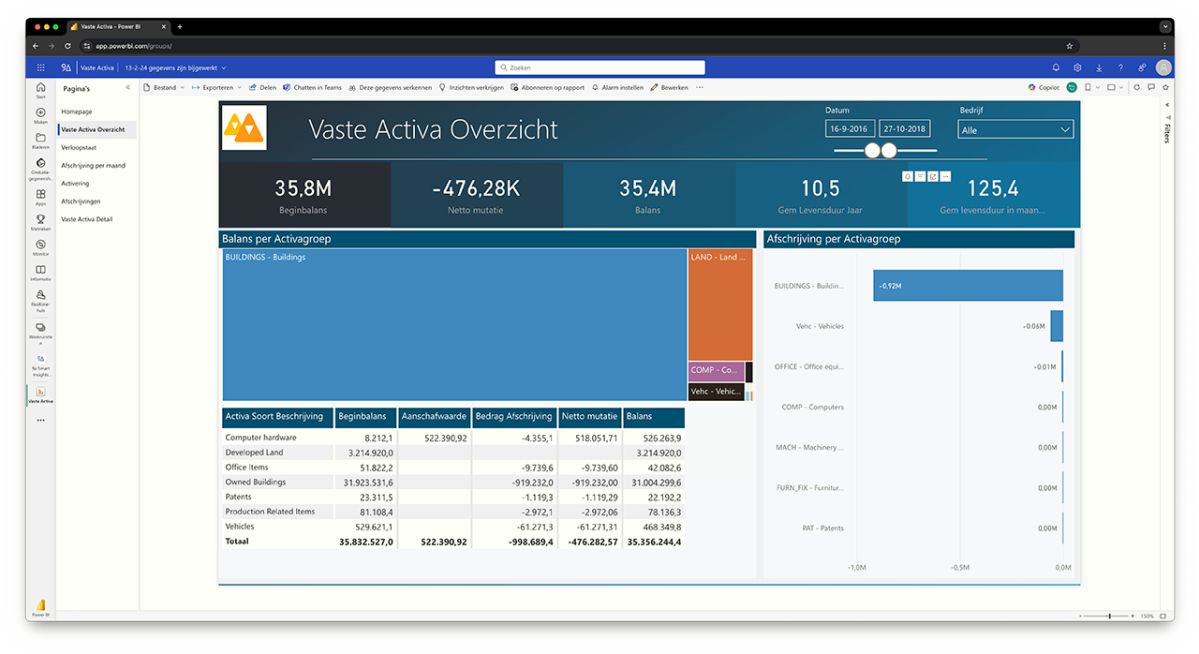
Vaste activa dashboards
Diepgaande inzichten in o.a. verloopstaat, afschrijvingen en afschrijvingen. Bekijk per bedrijf of per periode wat de resultaten zijn.
Met de verschillende componenten en drill-down mogelijkheden kun je vervolgens nog dieper in de activa overzichten en -afschrijvingen duiken.
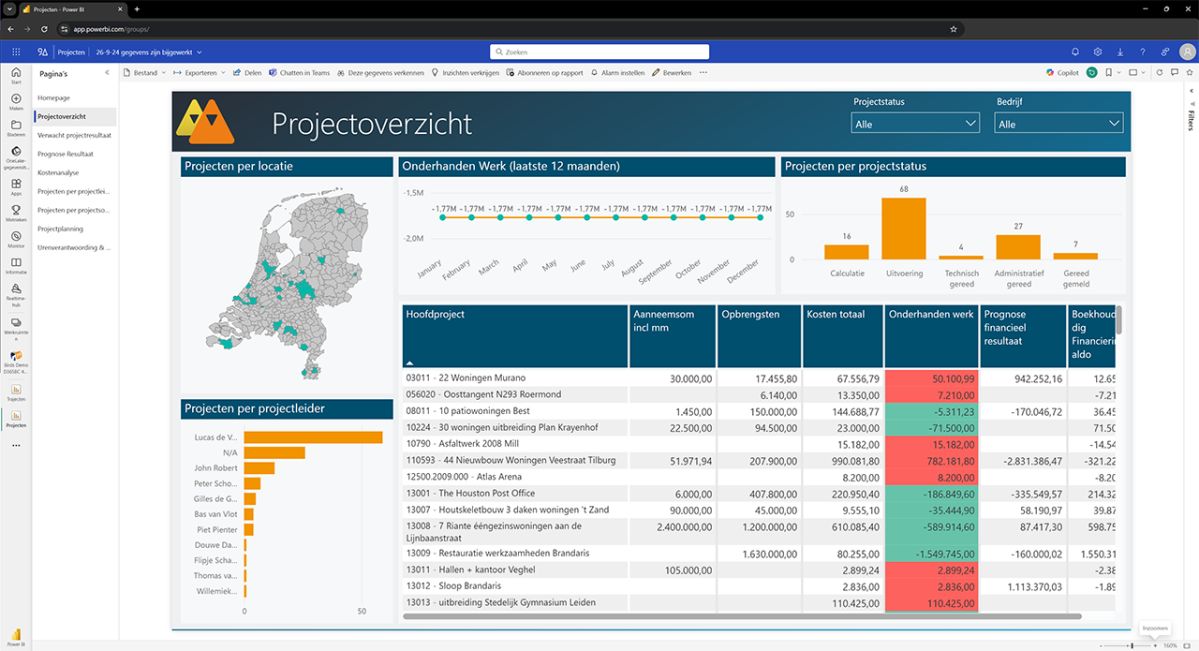
4PS Construct dashboards
Krijg diepgaande inzichten in alle aspecten van de bouwplanning en bekijk het rendement van projecten.
Analyseer de data o.a. op basis van project, traject, of locatie. Gebruik de verschillende componenten en drill-down mogelijkheden voor nog diepere analyses.

Veelgestelde vragen
Zeker. De Power BI-dashboards die met BIRDS worden geleverd, kun je gebruiken als uitgangspunt om na te denken over hoe je bepaalde data op een dashboard wilt visualiseren.
Met de data die Birds BI via het rijke datamodel in Power BI beschikbaar stelt, kun je vervolgens zelf rapportages en dashboards bouwen.
Ja, de Birds BI Power BI-dashboards en Content Packs werken zowel in de huidige Azure- en SQL Server-omgevingen als in de nieuwe Microsoft Fabric-structuur.
Op zoek naar andere dashboards?
Heb je een Microsoft Dynamics-pakket en wil je data ontsluiten uit software die hier niet wordt vermeld? Onze BI-consultants kunnen data uit vrijwel elke bron ontsluiten voor gebruik in Power BI.
Benieuwd naar de mogelijkheden?